1/6


Barograph
1K+Unduhan
7.5MBUkuran
1.3.6(10-06-2024)Versi terbaru
RincianUlasanVersiInfo
1/6
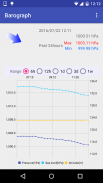
Deskripsi Barograph
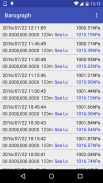
Grafik Tekanan atmosfer, tekanan udara rata-permukaan laut, elevasi.
Anda dapat melihat perubahan tekanan atmosfer secara visual.
Selain itu, Anda dapat melihat nilai-nilai tekanan atmosfer juga minimum dan maksimum 24 jam terakhir.
Nilai-nilai ini untuk Lihat nilai diukur dengan smartphone dari sensor. Anda dapat memahami Tekanan atmosfer ruang Anda.
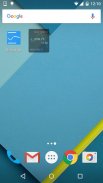
layar awal dengan menempatkan widget dari aplikasi ini, Anda dapat melihat tekanan atmosfer, yang diukur setiap saat.
Barograph - Versi 1.3.6
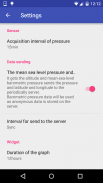
(10-06-2024)Apa yang baruVersion 1.3.6-------------Added a mode to directly input values to calibration on the preferences screen.
Barograph - Informasi APK
Versi APK: 1.3.6Paket: jp.craftsoft.barographNama: BarographUkuran: 7.5 MBUnduhan: 7Versi : 1.3.6Tanggal Rilis: 2024-06-10 05:15:29Layar Minimal: SMALLCPU yang Didukung:
ID Paket: jp.craftsoft.barographSHA1 Signature: C1:22:7C:BE:9F:26:F2:3A:7E:96:41:14:04:9A:4C:A0:8D:C2:1E:D2Pengembang (CN): Mikihiro HayashiOrganisasi (O): CraftSoftLokal (L): MoriokaNegara (C): JPProvinsi/Kota (ST): IwateID Paket: jp.craftsoft.barographSHA1 Signature: C1:22:7C:BE:9F:26:F2:3A:7E:96:41:14:04:9A:4C:A0:8D:C2:1E:D2Pengembang (CN): Mikihiro HayashiOrganisasi (O): CraftSoftLokal (L): MoriokaNegara (C): JPProvinsi/Kota (ST): Iwate
Versi Terakhir dari Barograph
1.3.6
10/6/20247 unduhan7.5 MB Ukuran
Versi lain
1.3.5
16/10/20237 unduhan4 MB Ukuran
1.3.4
7/9/20237 unduhan4 MB Ukuran
1.2.2
22/4/20197 unduhan9 MB Ukuran


Aplikasi pada kategori yang sama

Anda juga mungkin suka...
Aplikasi pada kategori yang sama

English


